
- The 14 Best AI Sales Software Tools - July 30, 2025
- 13 Best Product Tours Software - July 18, 2025
- What is Generative Engine Optimization (GEO) and the 9 Ways to Do It - March 26, 2025
A step-by-step, tactical guide on how to create the perfect marketing dashboard, according to Growth Marketing Pro, Hailey Friedman.
Data Driven Marketing is a hot topic right now.
We all know it’s important.
Our Directors and CEOs and board members all want to see the numbers. But there doesn’t seem to be a “best practice” example anywhere of how it should look.
What should your marketing dashboard look like?
What metrics are important to track?
It’s annoying because it doesn’t seem like it should be this difficult. I’m going to simplify it.

Whether you’re a marketer within a brand, small business, large organization or agency you definitely need a visual and numeric way to display your marketing data.
But before we dive in, let me tell you a little bit about my marketing data journey.
Table of Contents
My Marketing Data Journey
My name is Hailey Friedman ?

I was born in a little town on Long Island, New York called Dix Hills

Went to Emory University in Atlanta, Georgia


After that, spent 2 years as an 8th grade English teacher in the Bronx through Teach For America.
![]()

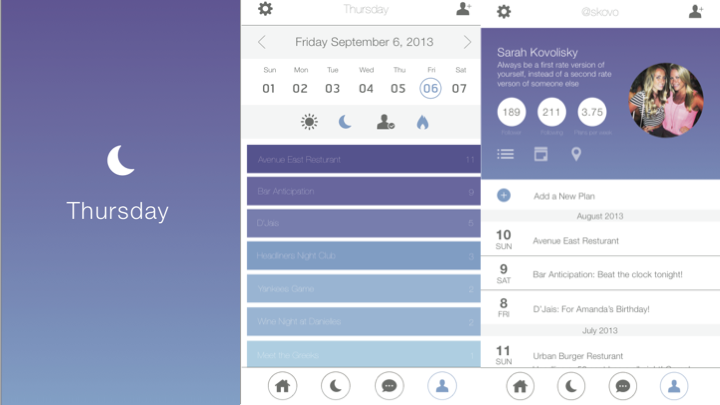
While I was teaching, I had an idea for a mobile app called Thursday and I put together a team of people from across the country and we worked on this app together remotely, and launched it on the app store.

And that’s where I learned this important lesson:
You can have the greatest team and the perfect product, but if you don’t know how to get customers, then you don’t have anything worth much at all.
That’s when I became really fascinated with marketing.
It’s what set me off on my journey to learn what it really takes to get “Joe Schmo” to sign up for something or to buy something.
I really wanted to figure that out.
So I decided to join a startup in New York, at the ground floor, to try and learn everything I could about what it takes to start and grow business.


As the second employee at Zapp360, I learned a ton about growing a business. But I wanted to learn more about consumer marketing, specifically.
So I decided to hop on a plane and move to San Francisco, all by myself, leaving my friends, family and boyfriend behind.
I wanted to be submerged in the world of tech startups and finally get my feet wet in marketing

45 phone and skype interviews later, I got an offer from a man named Mark Spera. He was the Director of Marketing at RealtyShares.

![]()
So I joined RealtyShares as the 2nd marketing hire. And with the help of Mark and a lot of Neil Patel’s blog posts, I finally started to become a marketing ninja.
I was lucky to have Mark as a mentor. He took me under his wing and pushed me to get better at things I struggled with. Which was primarily– marketing data.
Spoiler alert: we would later become great friends and build this blog together!.


Historically, I had always been more of a creative, language minded person. But as I began to learn more about marketing, I discovered that unfortunately, it’s very heavy in math. You’ve got to be good with numbers.
When you’re spending someone else’s money you better be able to justify that that money is being well spent and resulting in more revenue for the company rather than cost.
Mark really pushed me to wrap my head around the numbers. I taught myself excel–even though I was really slow at it– and Mark made me responsible for reporting on all of our marketing campaigns, all of our budgeting, all of our forecasting, and presenting this data every week to our CEO.
That’s when I discovered that staying on-top of all that data can be really time consuming considering all the different places where our data is stored.
Managing Marketing Data Can Be Very Time Consuming
For example:
- I’m looking at website traffic on Google Analytics
- My paid ad campaigns are living on the Facebook platform, or Adwords or Linkedin
- Data about my leads or customers might live in a CRM like Salesforce or Pipedrive.
- And then if I want to see different events that are going on my website, my website funnel data would be visible through a program like Mixpanel or Heap or Segment.
There are all these tools.
All these platforms.
It’s kind of a lot to keep track of.
At RealtyShares, I needed to update our marketing dashboard every week and present it to our CEO. And he would rapidfire questions. I needed to be able to answer all of those questions on the spot by looking at our data. It wasn’t fun.
The work was pretty tedious and manual. It took me a ton of time every week to update our dashboard. Usually, 10 to 20 hours each week.
I gradually became better at it of course. I was beginning to understand the math behind all these dashboards but ultimately, aggregating data was NOT how I wanted to be spending my time.
So Mark and I agreed that we would hire a Marketing Data Analyst. Someone who would work on our data full-time. So we brought on Brian Zheng.

^ that’s him.
He was responsible for updating our dashboards every week. And I used to say to him, “There’s got to be a better way. Can’t we automate this?”
And he looked into it. He did some research and he semi-automated parts of it.
Every week he would log into each platform, export all the data and then he would dump all the data into a tab in excel that would populate other tabs in our dashboard using formulas. It was still pretty manual and time consuming, even though he was able to automate parts of it.
Over time, I’ve gotten more and more involved in marketing.
I became president of a meetup group called Badass Marketers & Founders, with over 20,000 members globally.


And I’ve been continually fascinated by this whole marketing data challenge and how we can make it better.
During my time at RealtyShares, I noticed a couple of mistakes that I was making with my data and that I think marketers in general are probably making all the time.
Avoid These Marketing Data Mistakes
There are 5 big mistakes I’m seeing marketers make all the time:
- Lack of documentation
- Do you have a daily, weekly, monthly and yearly view into what’s going on?
- Are you documenting when you make big announcements, start new campaigns, or make changes to your site/product?
- Do you keep track of baseline metrics before you make changes, and measure lift afterwards?
- Wasting time
- How much time do you spend gathering data?
- How much time do you spend analyzing data, optimizing campaigns, running new tests and thinking strategically?
- Do you have a full time employee devoted to data?
- Can you automate parts of this process?
- Here’s a great eBook to help you decide if you should Build or Buy a solution to this problem.
- Looking at the wrong metrics
- Are you seeing the whole picture from end to end? Acquisition to Revenue?
- Are you using the right marketing analytics tools that allow you to see the complete picture?
- Lack of visualization
- How are you showcasing marketing performance to outside stakeholders?
- Does your leadership team have access to real-time marketing metrics?
- Messy data
- Do you have consistent naming conventions for your ad campaigns?
- Tracking pixels set up for every marketing platform you’re working with?
- Are you using adding UTM parameters to every link you use in marketing campaigns?
- You can do this with the Google Analytics URL builder or UTM.io
Keep in mind: taking the time to get organized and efficient upfront will ultimately lead to more revenue.
What came next on my data driven marketing journey…
So a few months ago I decided to leave RealtyShares.
I was looking for a new job and I was interviewing with a bunch of different companies, and then I asked myself, “What do I really want to do?”
I decided I wanted to work on a product that I love. So I thought about the things that I love. And I realized that I really love marketing.
I have a marketing blog. I have a marketing community. My life would be so streamlined if I could do marketing for a company whose product, was a tool that helps marketers. Very meta, I know.
But when you know what you love, go all in, right?
How I found a job in Marketing Data Analytics
A friend reached out to me and told me that there was a startup called Improvado that was looking for a head of marketing. So I was like, ok cool.
So I do a bit of research and then I realize, holy sh*t. This is EXACTLY the tool that I was looking for.
Improvado automates the process of collecting marketing data.
So ALL the work that me and Brian were doing every week? POOF. Automated.
That’s when I decided to take the job as the head of marketing at Improvado!
It felt really serendipitous that this opportunity had fallen into my lap and it hit the exact criteria that I was looking for — a tool that helps marketers.
And it happened to solve the biggest pain point that I had ever felt as a marketer, which is — automating the collection of all of your marketing data.
So I was really excited.
![]()

But here’s the scary part.
I had to walk into a blank slate.
Being the first marketing person on the team, I had to set up all of our data tracking and dashboards by myself.
I remember my stomach dropping at the thought of it because (and keep in mind this was only a few months ago, so this is all super real and super recent) I knew I was capable of it, but I was having PTSD thinking back to the days where I had managed all of our data at RealtyShares and it felt overwhelming to have to pick that back up again.
But I finally buckled down and started.
So I set up a dashboard in Google Sheets. And the reason I chose Google Sheets was so that it would be easy to share with anyone who wanted access.
And I started going into all the different platforms that Improvado had been using and trying to figure out which data sources were true, which made sense, what the naming conventions were, were the tracking pixels in place?
Really just trying to make sense of it all.
I spent about 10 hours one Sunday putting it all together. I was pretty proud of myself when it was over but the process was quite manual. And I knew I’d have to re-do it every week or month in order to keep it up to date– or at least that’s how I’d always done it in the past.
The next day I bring in my dashboard, and I sit down with the cofounder of Improvado, Anamika.
Within 5 minutes, she showed me how her tool automated the entire process that I had just spent 10 hours working on.
I was actually floored.
I felt two emotions, pretty strongly, at the same time.
One was anger.
Anger that I had just spent 10 hours working on something that could have been accomplished in a matter of minutes (or really I guess If you counted all the hours that I ever spent wrangling data in my marketing career it would have been hundreds or thousands of hours wasted.)
Two was relief.
This huge sense of relief that I would never again have to waste all those hours because everything would be available for me in one simple place.
I’ll tell you more later about how to automate your marketing data but first…
How I setup my digital marketing dashboard
To make sure I capture everything
It’s important to set up your marketing data manually at first to make sure you’re understanding all the different views and metrics that you should be tracking.
Before you automate something, you need to first do it manually so you can understand exactly what you’re trying to automate.
How to Setup Tracking
- Set up a Google Docs Spreadsheet for your manual dashboard
- When I came into Improvado, the first thing I did was set up a Google Spreadsheet (the one I was telling you about earlier that took 10 hours to put together).
- Place tracking pixels on the website
- I made sure that there were tracking pixels on the site for facebook and Google Analytics and all the various things I was going to be tracking.
- Add UTMs to every link
- I made sure to add UTMs to every link within marketing campaigns that I am running so I could attribute leads to the right channel. I also put together a consistent naming convention so that it would be easy to sort through future data.
- Get the right analytics tools so you can see the entire picture
- You MUST have:
- For counting web visits & conversions= Google Analytics
- For customer attribution= Mixpanel or Heap
- For keeping track of lead & customer data= A CRM like Salesforce or Pipedrive or even just a spreadsheet
- NICE to have:
- For viewing heat maps and videos of on-page behavior= Crazy Egg or UserTesting
- For A/B testing different features on your landing page or website: Optimizely or some landing page tools have A/B testing features internally like Instapage.
- For automating your data aggregation = Improvado
- You MUST have:
How to Setup Your Marketing Dashboard
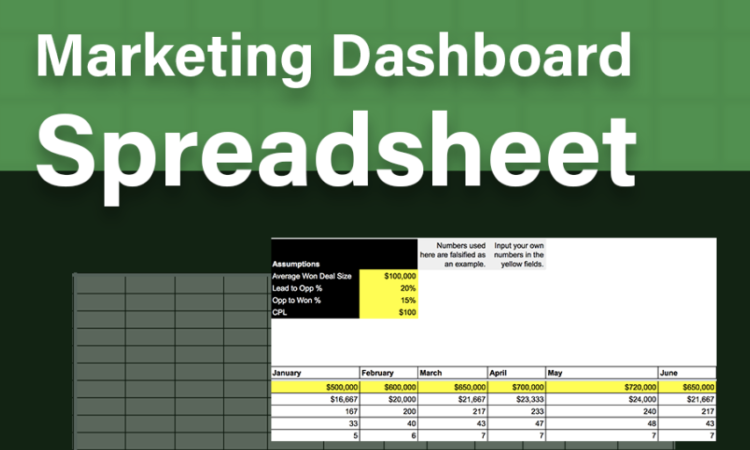
Let’s take a look at my marketing dashboard.
You can download a blank template copy of my marketing dashboard here.
Once you’ve downloaded my marketing dashboard template I will walk you through the dashboard I put together when I joined Improvado.
That way you can play around with it, take a look at all the different tabs and make a copy of it for yourself and use it, if you want to.
Keep in mind: once you download it and make a copy, you can modify the dashboard to make it make sense for you and your business.
At first I was updating all of this data manually every single day. Today, I automate all this data using Improvado.
What each of the tabs on my marketing dashboard mean:
Tab #1: Leads Daily
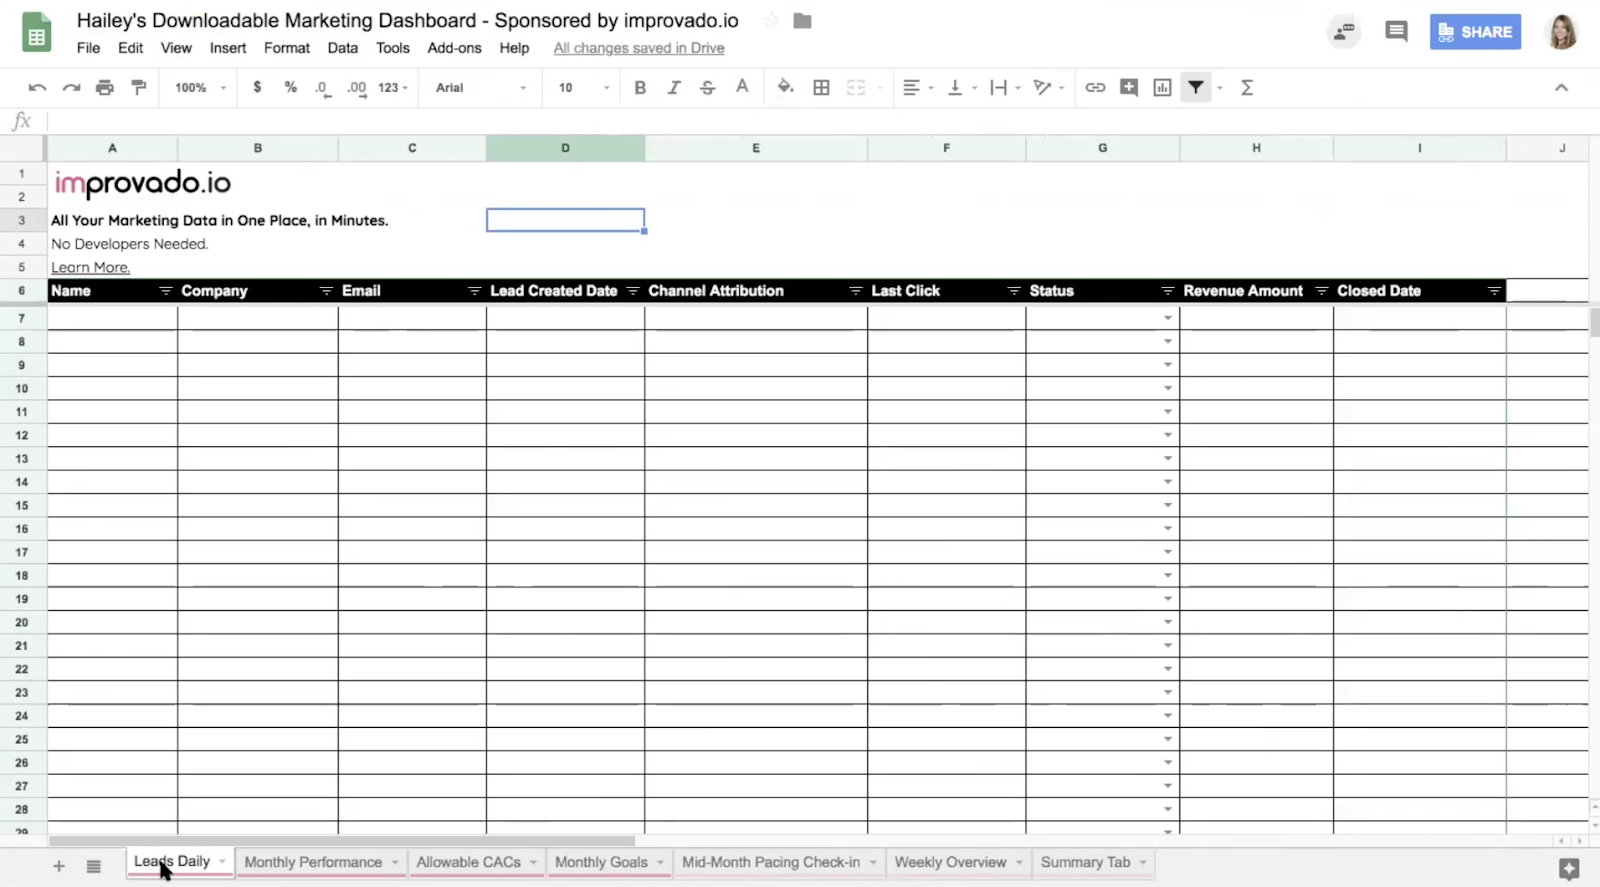
Every time we get a new lead in (at Improvado this is when someone requests a demo), I will know because I get an alert from Webflow (which is the tool we use to host our website).
And I will know exactly where that lead came from, because I can gather that data from Mixpanel, where I can see the Initial Referring domain of the site the lead came from and also the UTM parameters from the link they clicked on. I manually update the Channel attribution tab based on this data.
The last three columns come from data that I have in Salesforce about whether the lead became an opportunity, what stage it’s at, the revenue amount and the date the deal closed.
I gather all of this data about leads every day as they come in, and I do it on this first tab.
Tab #2: Monthly Performance
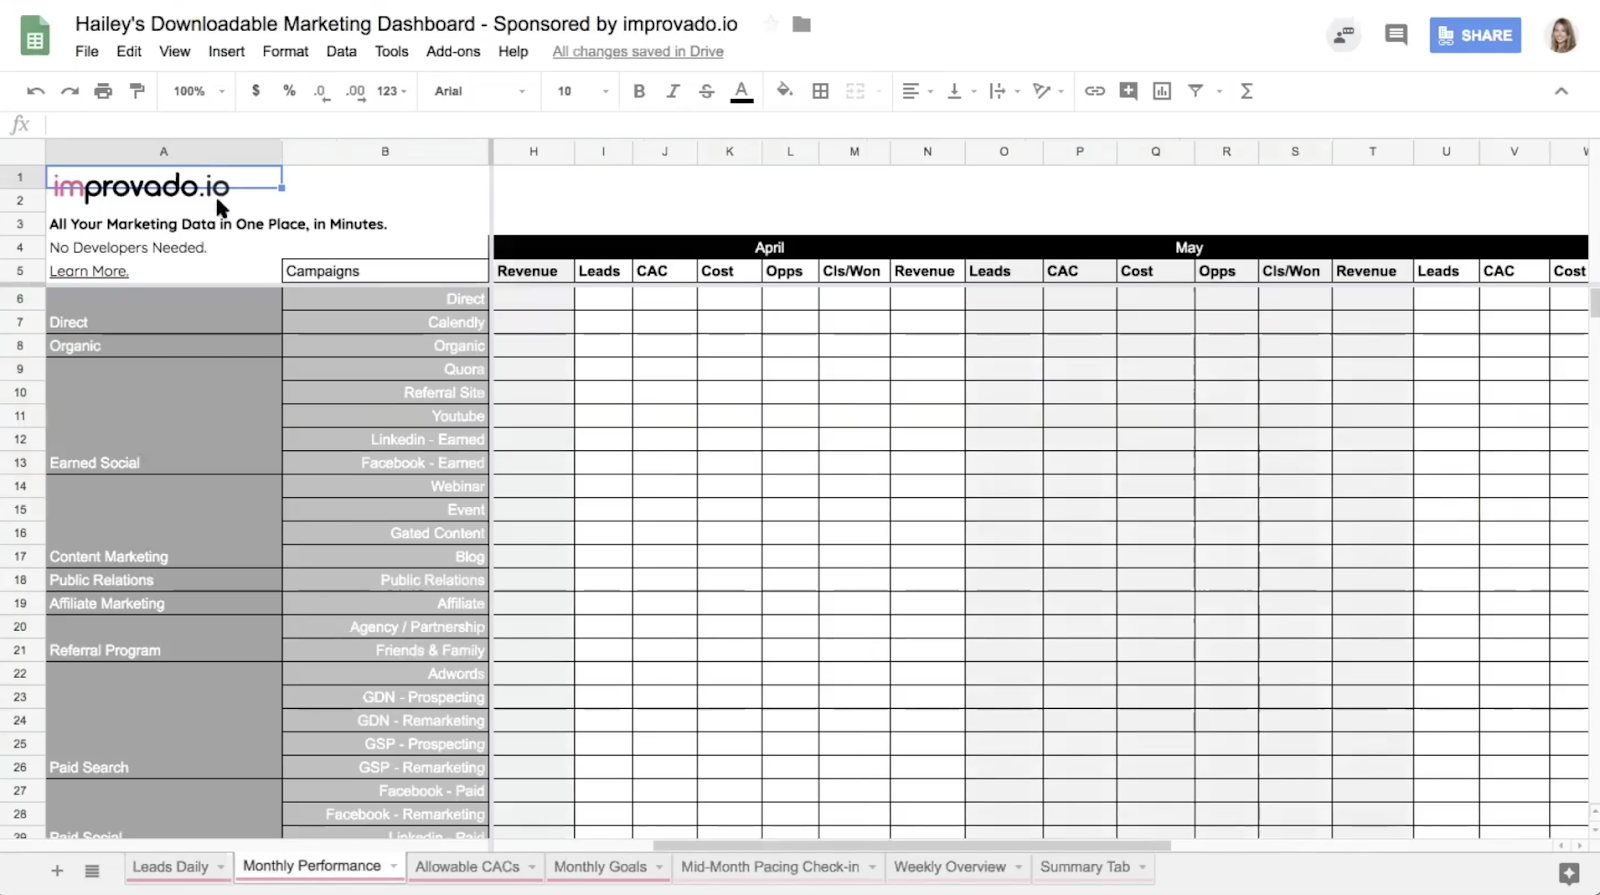
In this tab is the list of ALL the different marketing channels I’m running.
And each month I’m tracking
- The number of leads
- The cost per channel
- The cost per acquisition (CAC)
- The number of opportunities per channel (for B2B only)
- The number of closed/won deals per channel
- The revenue per channel
If you scroll to the bottom, you will see a summary over the overall stats for each month, broken out by the paid and unpaid channels and also the blended total.
You will also be able to see the growth in leads or opportunities or revenue month over month.
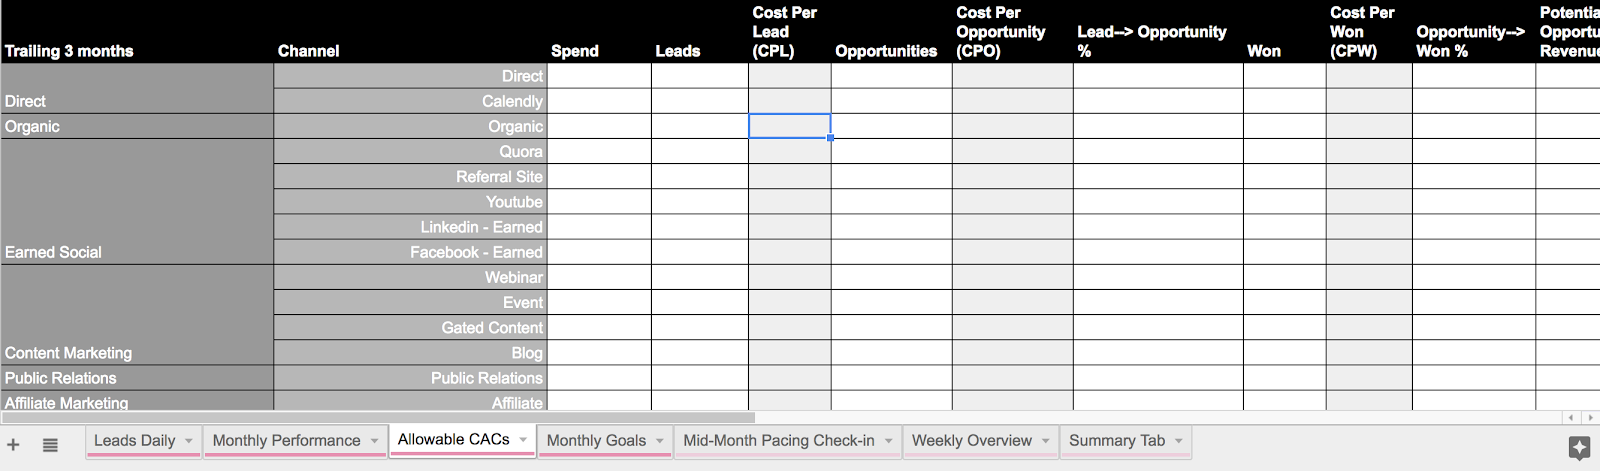
Tab #3: Allowable CACs
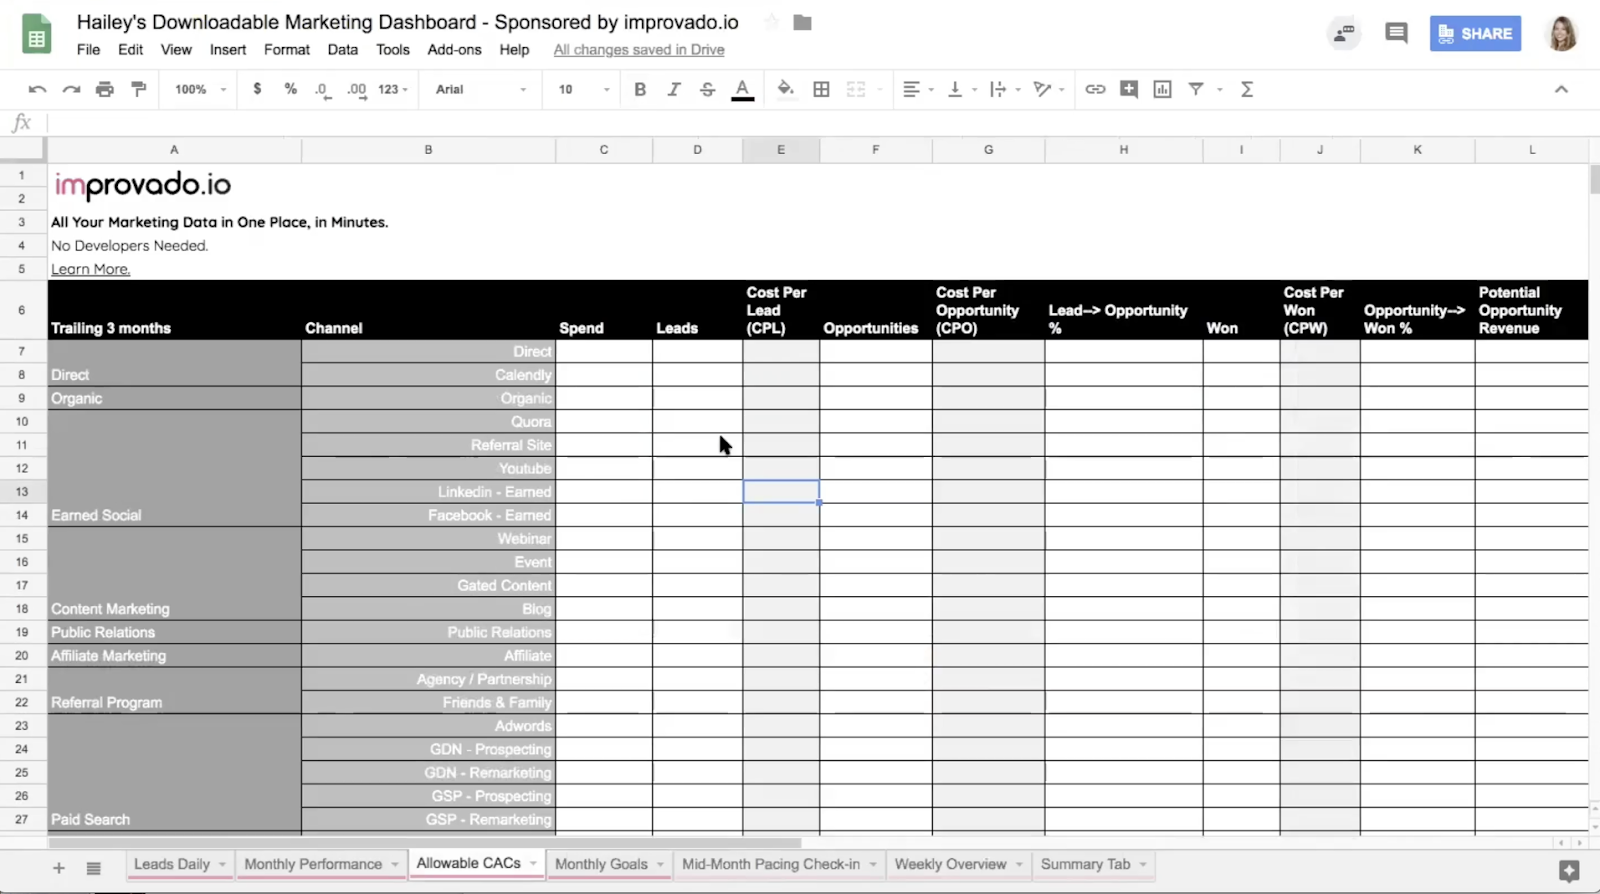
CAC stands for cost per acquisition.
The allowable CAC is basically the break even cost per lead that you can spend on each channel.
In this tab, you can see the revenue by channel and how much you are allowed to spend to acquire a lead within a specific channel.
This is SUPER important so that you understand, by channel, what you are allowed to spend.
If you are acquiring leads for a cost above the allowable CAC, you will be losing money.
If you acquire leads below the allowable CAC you will be earning money (potentially, depending on the rest of your overhead costs).
Keeping track of what the overall allowable CAC is month over month is an important metric to keep an eye on.
The overall cumulative allowable CAC number is more important than the allowable CAC by channel, especially if you are running some unpaid channels and some paid channels. This is because, the leads you are acquiring through unpaid channels can often make up for the high cost of the paid leads, therefore evening things out.
It’s actually a good thing if your allowable CAC is going up, because that means your leads are generating more revenue and you can justify spending more dollars per lead to acquire them.
If your actual CAC is going down, this is also a good thing because it means you are saving money.
Allowable CAC ⬆️ = ?
Actual CAC ⬇️ = ? However, it’s okay if Actual CAC goes up as long as the Allowable CAC is still higher than the Actual CAC.
I typically track the allowable CAC by including data over the course of the trailing 3 months.
Tab #4: Monthly Goals
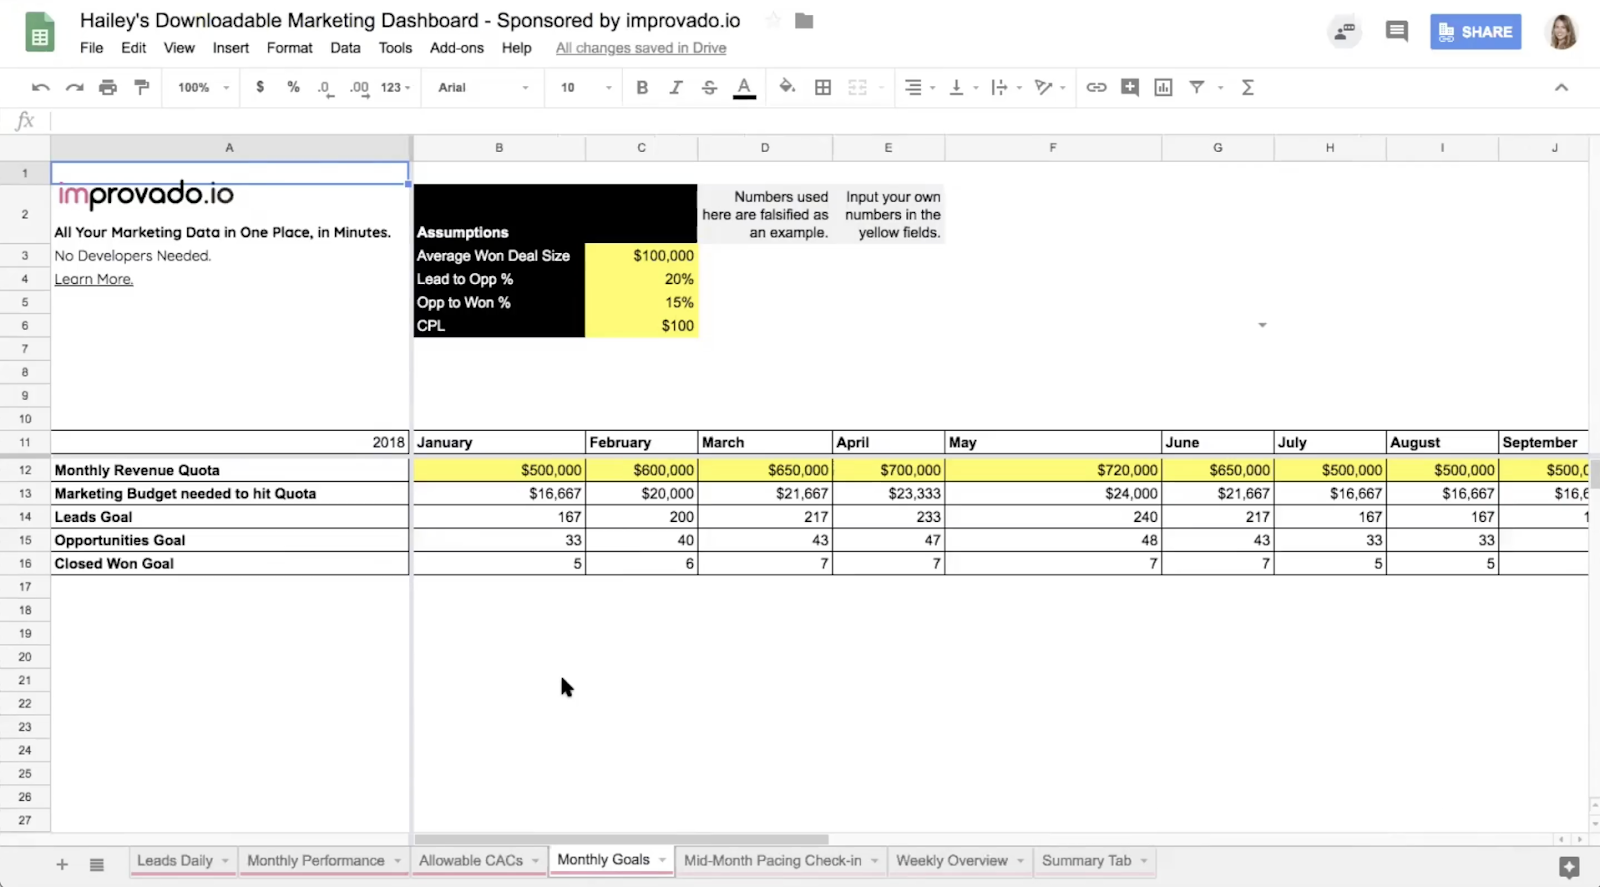
This tab will help you figure out what your marketing goals should be.
You might be asking yourself, “what should my marketing goals be every month?”
Or maybe you have a superior telling you what your goals are.
But you should be able to work backwards to figure out what your marketing goals should be based on the overall company-wide revenue goals for the year or for the month.
Each month or each year, someone at your company, maybe it’s your CEO, is putting together projections for the year, how much revenue they want to achieve. And they might have monthly quotas around how much revenue they want to make every month.
This tab will let you back out what your marketing goals should be based on the revenue goals that you set for yourself as a company.
There are some assumptions that you can change:
- Average won deal size
- Lead to opportunity conversion rate
- Opportunity to Won deal conversion rate
- Cost per lead
If you have all of these metrics (which you will if you fill out the allowable CAC tab properly), then you can work backwards to figure out how many closed won deals you’d need in order to get to the revenue you need per month.
In order to get to the amount of closed won deals, you’d need a certain amount of opportunities (an opportunity is a qualified lead).
To get to that number of opportunities, you’d need to acquire a certain amount of leads.
And to get to that number of leads, you’d need to spend a certain amount of dollars on marketing, depending on what your average cost per lead is (which can change as you optimize your marketing efforts).
This is a great tool for justifying how much marketing budget you’ll need to hit your marketing goals.
Tab 5: Mid-Month Pacing Check-in
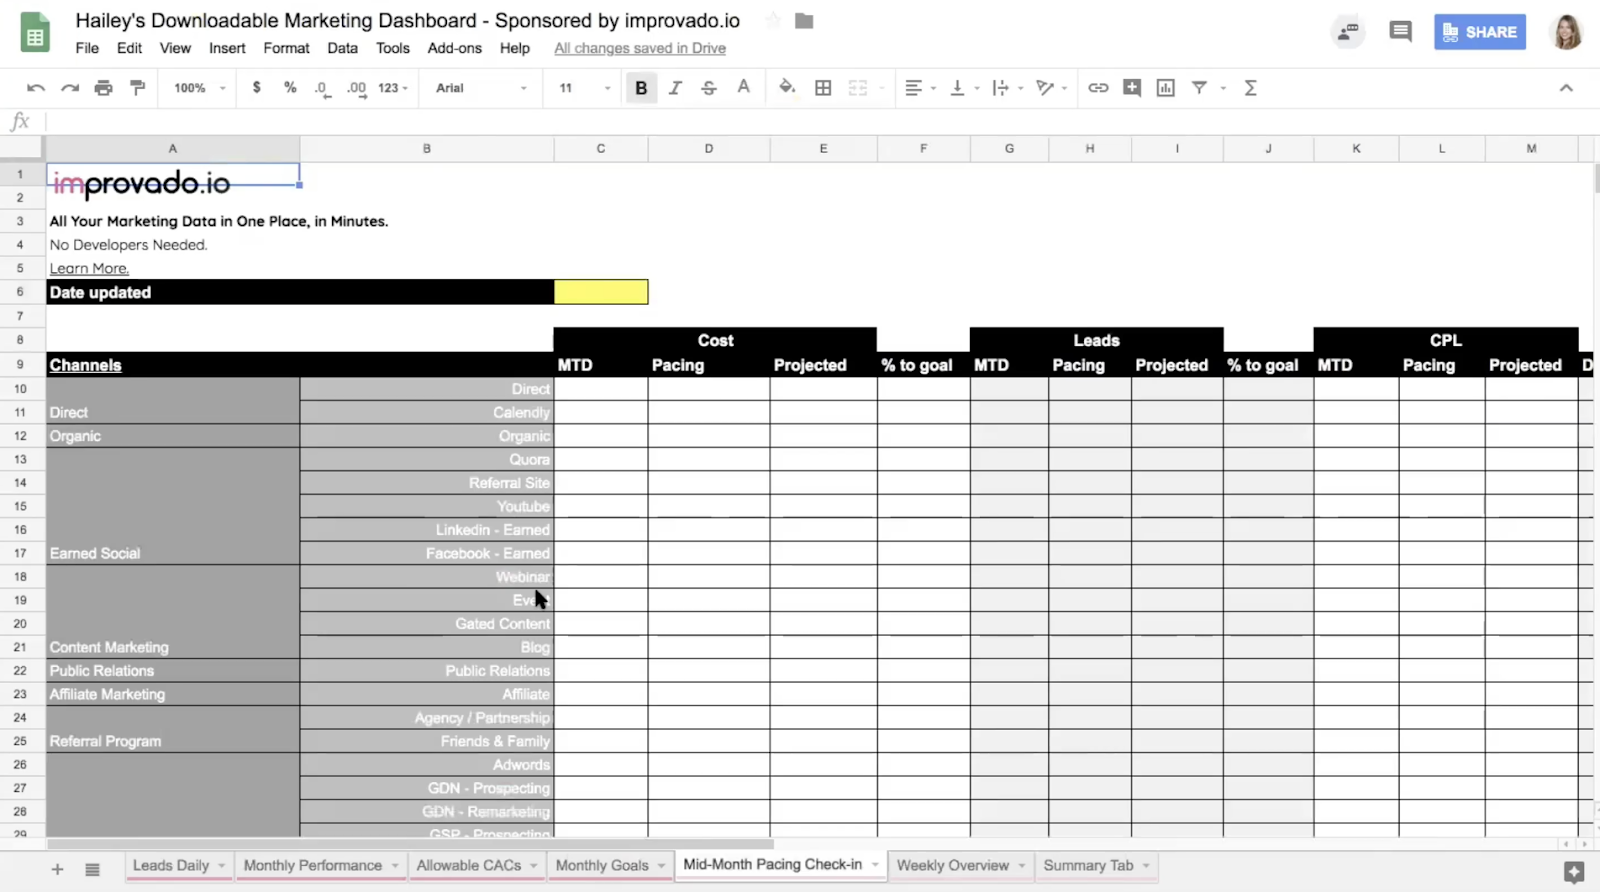
This tab is useful if you’re halfway through the month and you want to know,
“Am I pacing to the goal or am I pacing below the goal?”
“Do I need to ramp up spend in a certain channel before the end of the month, or pull back on a certain channel because it’s spending money too fast?”
This can be tedious to fill out, but it can be really important because you don’t want to just check in at the end of the month and realize you went way over budget in a specific channel.
So if you’re going to be keeping track of this manually, this is a great way to look at it. And if you’re going to automate this data, I will show you how to do so shortly with Improvado.
Tab 6: Weekly Overview
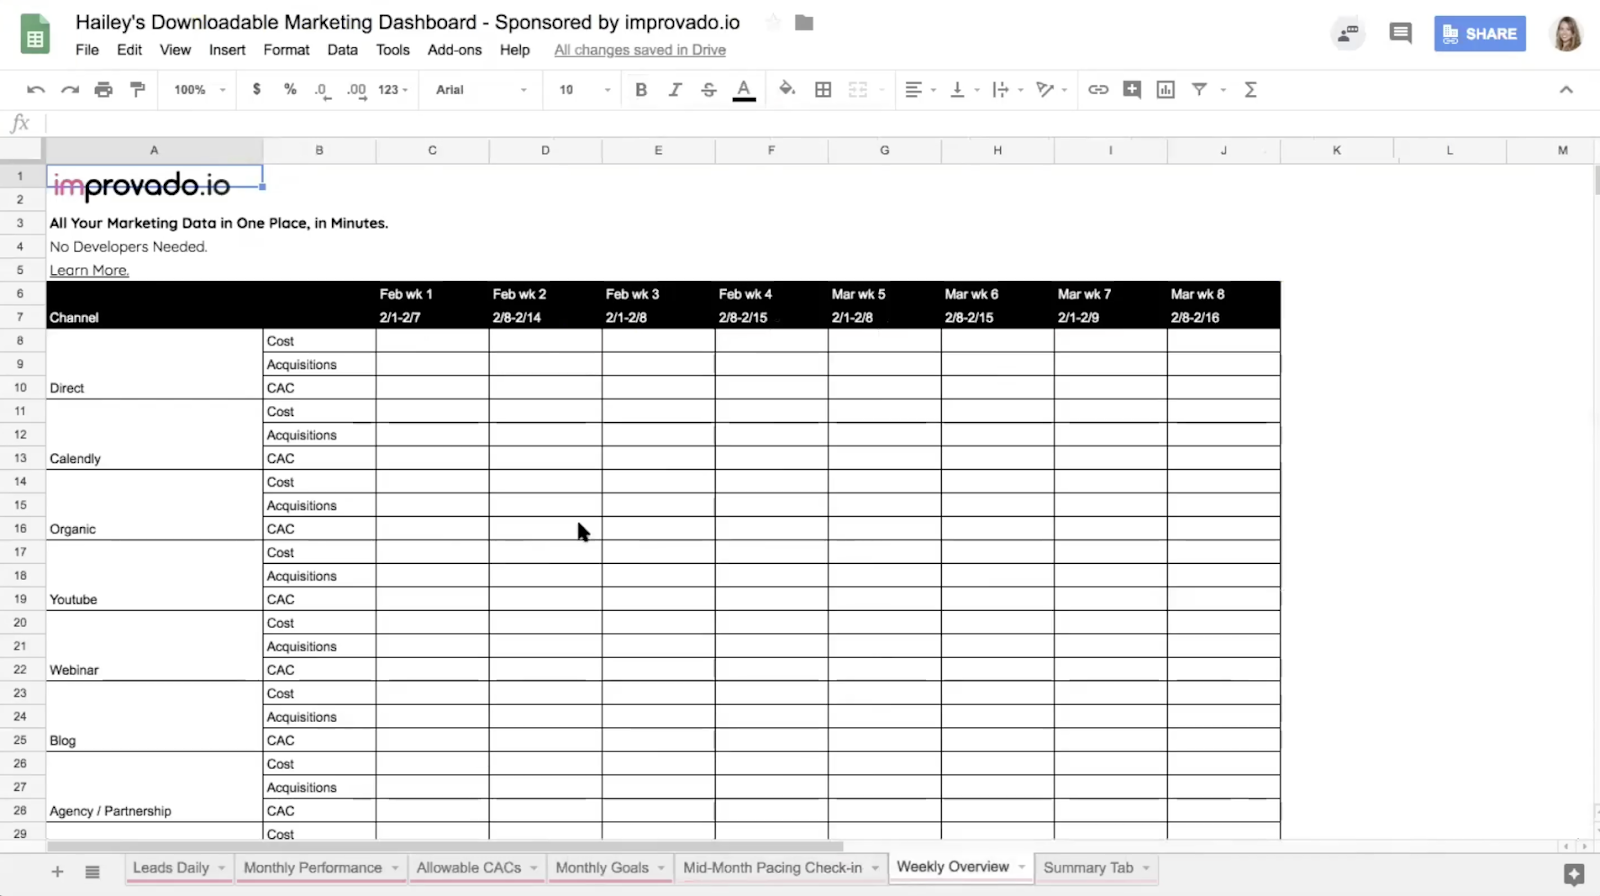
This tab is the same as the one before, except it looks at all your campaign performance weekly.
Like I said, this is great if you want to catch red flags around how your acquisition is pacing so that you can make changes every week to ensure you’re on target to hit your goals.
This is also tedious to update manually, but luckily there is a way to automate it, which I will get to shortly.
Tab #7: Summary Tab
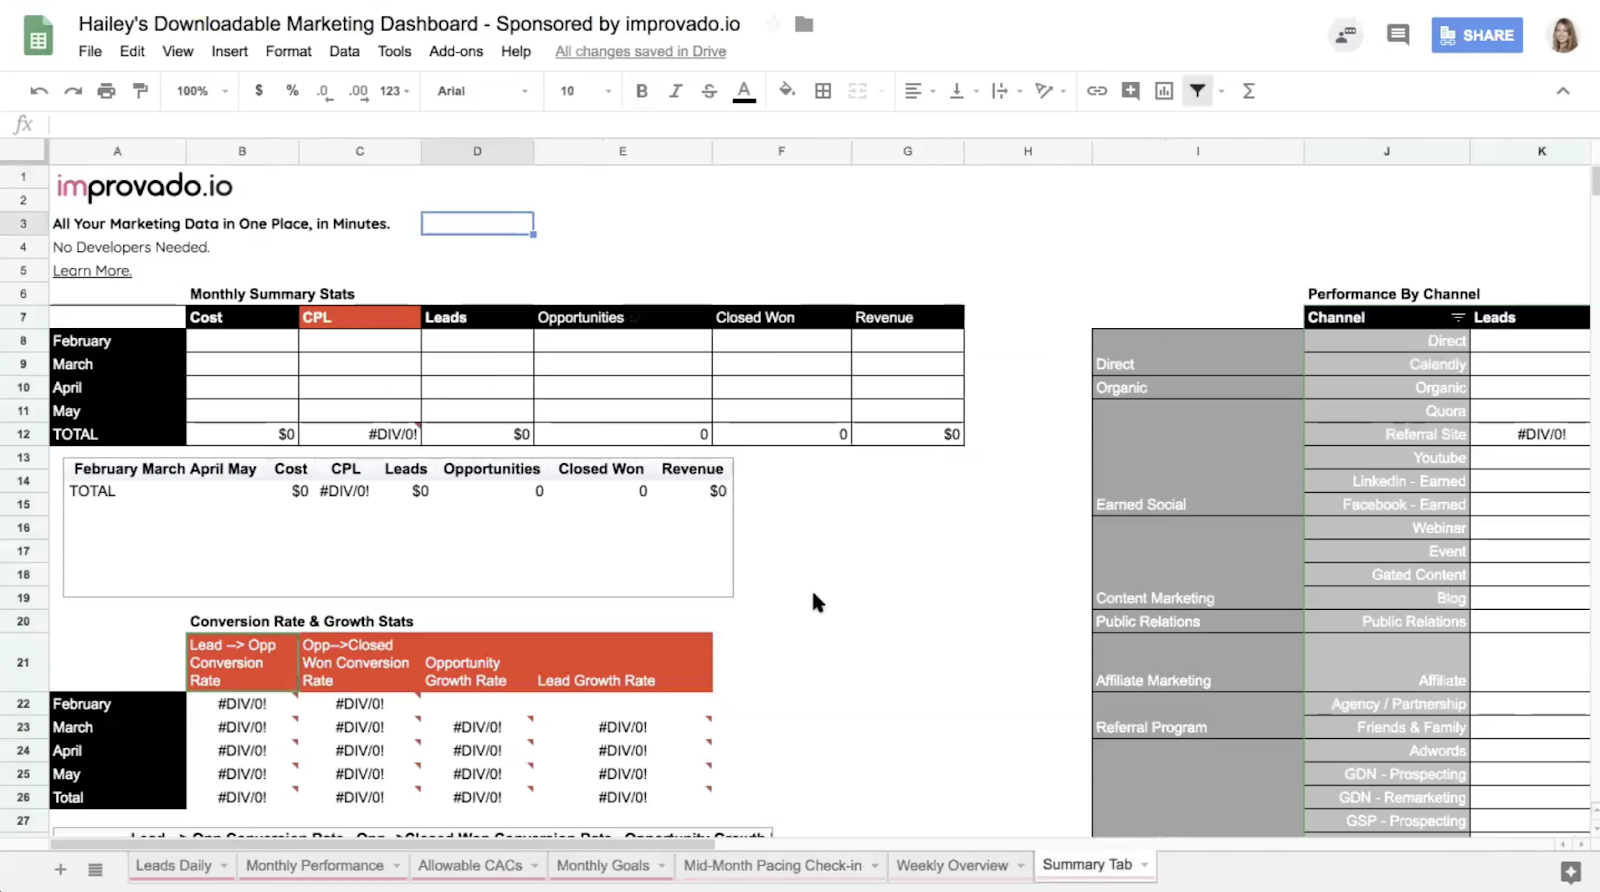
This tab is important because it will help you visualize your marketing campaign performance for your CEO or leadership team.
You can’t show your CEO this dashboard.
Her/his eyes will glaze over.
It’s too many tables and numbers. It’s way too granular.
You need to make the data tell a story visually, so that people outside of your marketing team will be able to quickly understand it.
You’ll need to make pretty charts and graphs to put into a presentation deck that acts as a digital marketing report that you’re going to share with outside stakeholders where you call out the big changes each month. The big key takeaways.
The summary tab is where I keep track of little charts and graphs I make.
Again, this is how you do this manually. But if you want to automate your reporting it and have a real-time marketing dashboard that any outside stakeholders can take a peek at, at any time, then that’s where Improvado can help.
How to Show ROI for the Marketing Campaign You Just Ran
The Allowable CACs tab is where you will find this data. If you haven’t already downloaded the marketing dashboard template, please download it now.
This Allowable CACs tab is showing:
- Revenue by channel
- Return on ad spend, ROAS or ROI
- Customer Lifetime value or LTV
- And more.
Track These Metrics to Forecast Future Performance
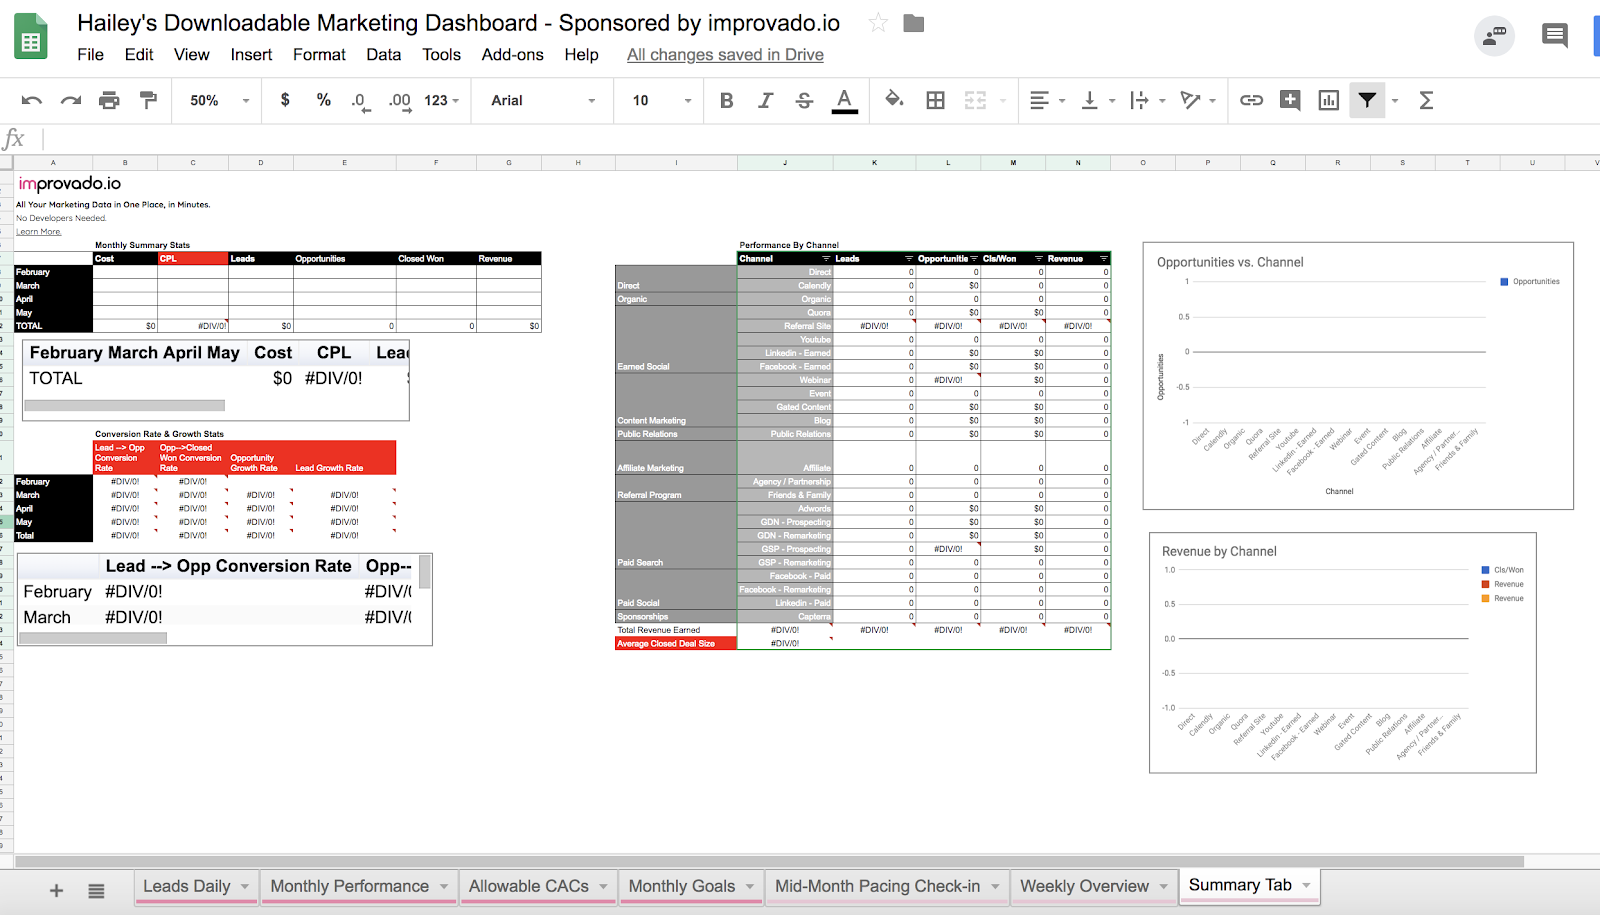
The Summary tab will help you keep track of:
- Lead → Opp Conversion Rate
- Opp → Won Conversion Rate
- Lead Growth Rate
- Opportunity Growth Rate
- CPL
- Average Won Deal Size
When you plug these metrics into the yellow fields in your Monthly Goals Tab, this will allow you to forecast future performance and map out your goals.
If you know what your Lead Growth Rate and Opportunity Growth Rate has been over the trailing 3 months, you will be able to forecast forward the growth you will likely see in the coming months, or at least an educated guess.
How to Automate All Your Marketing Data
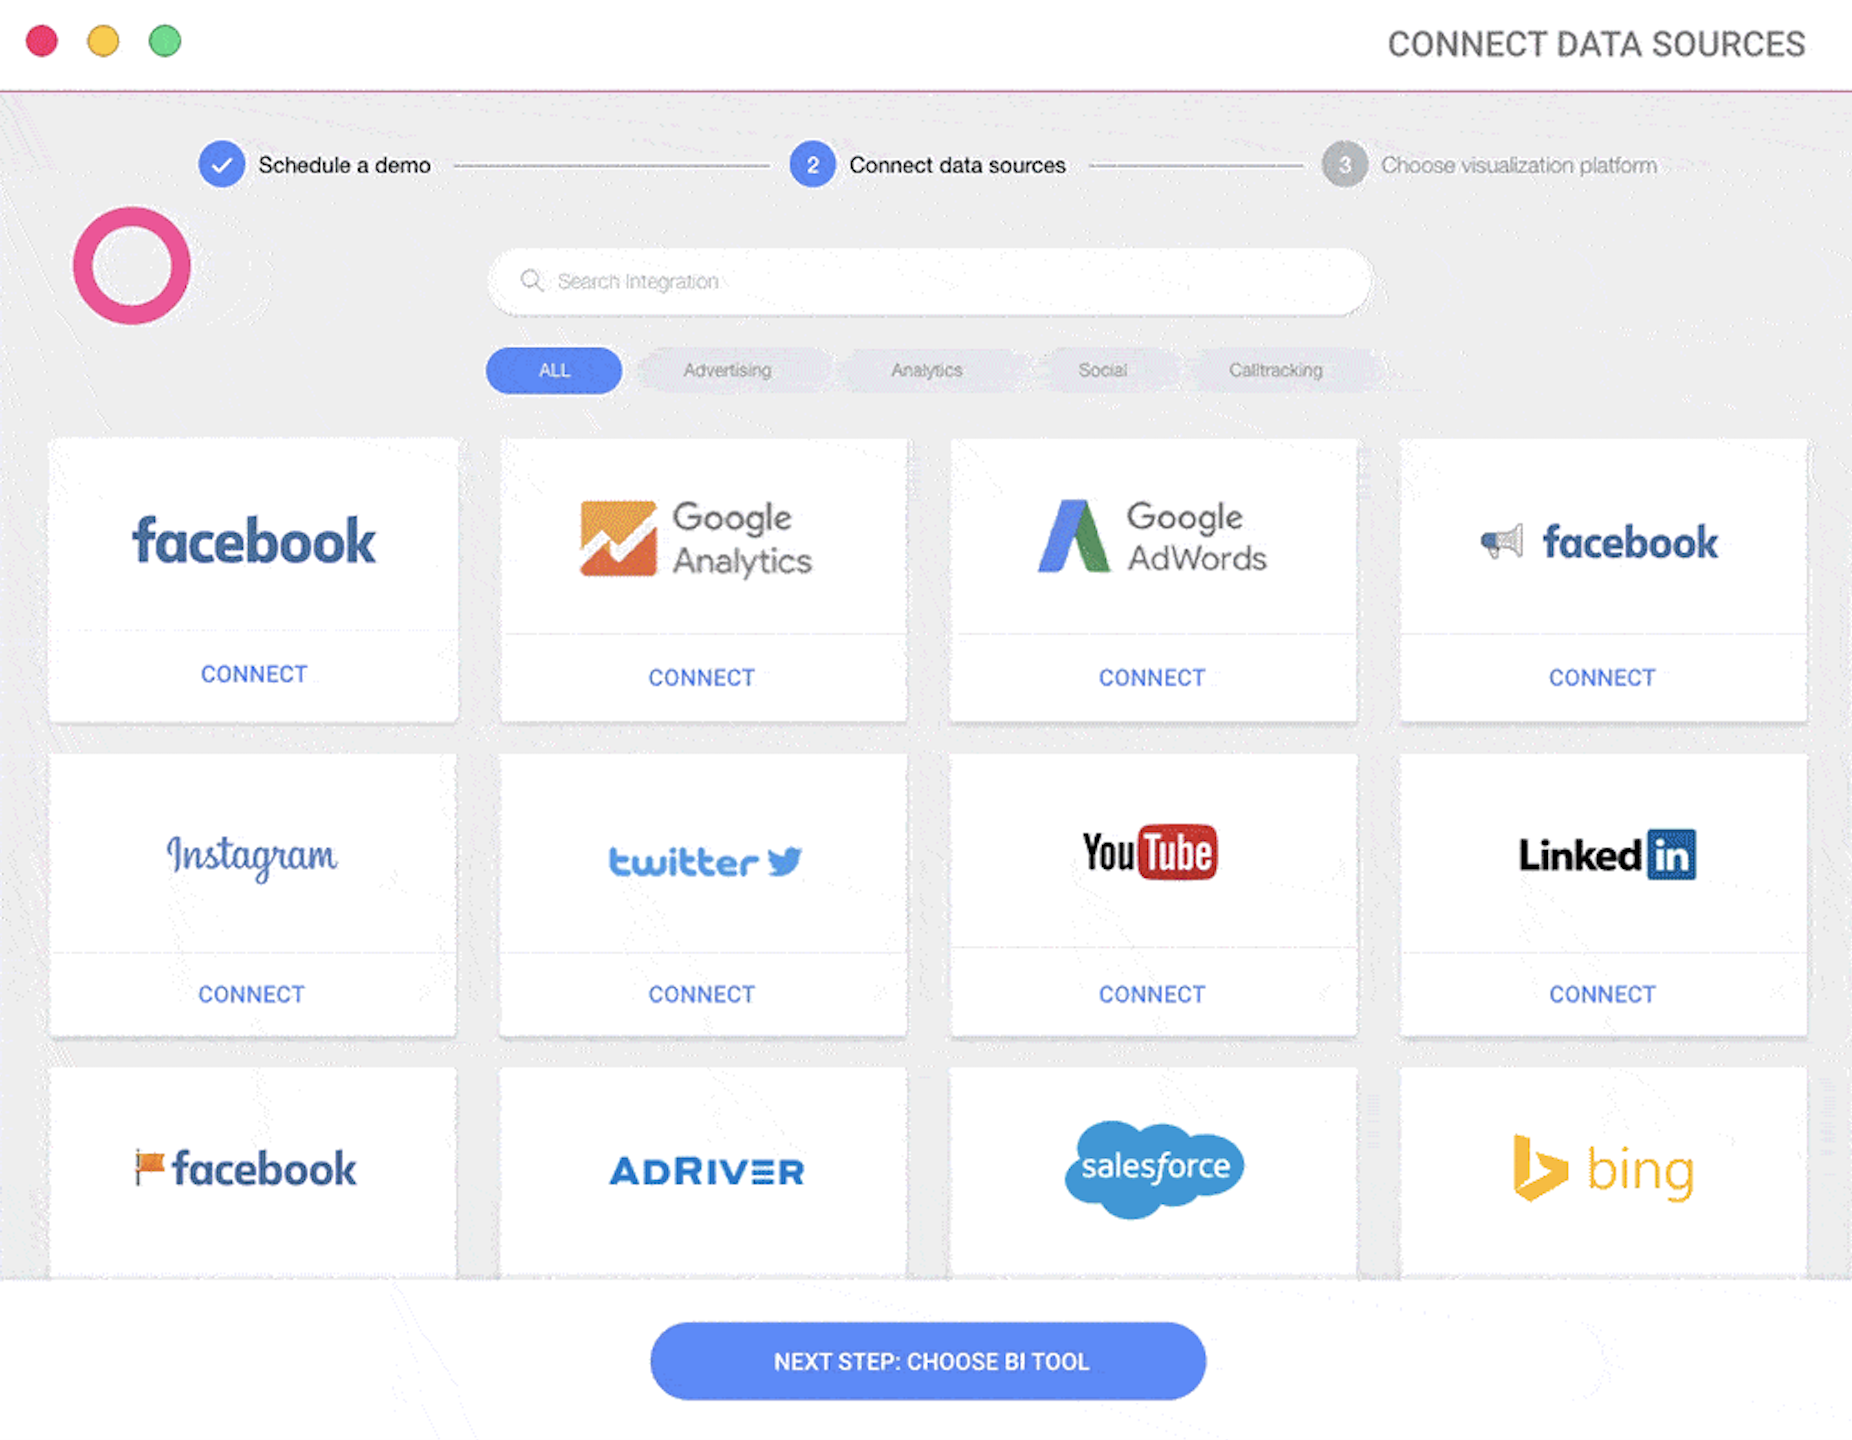
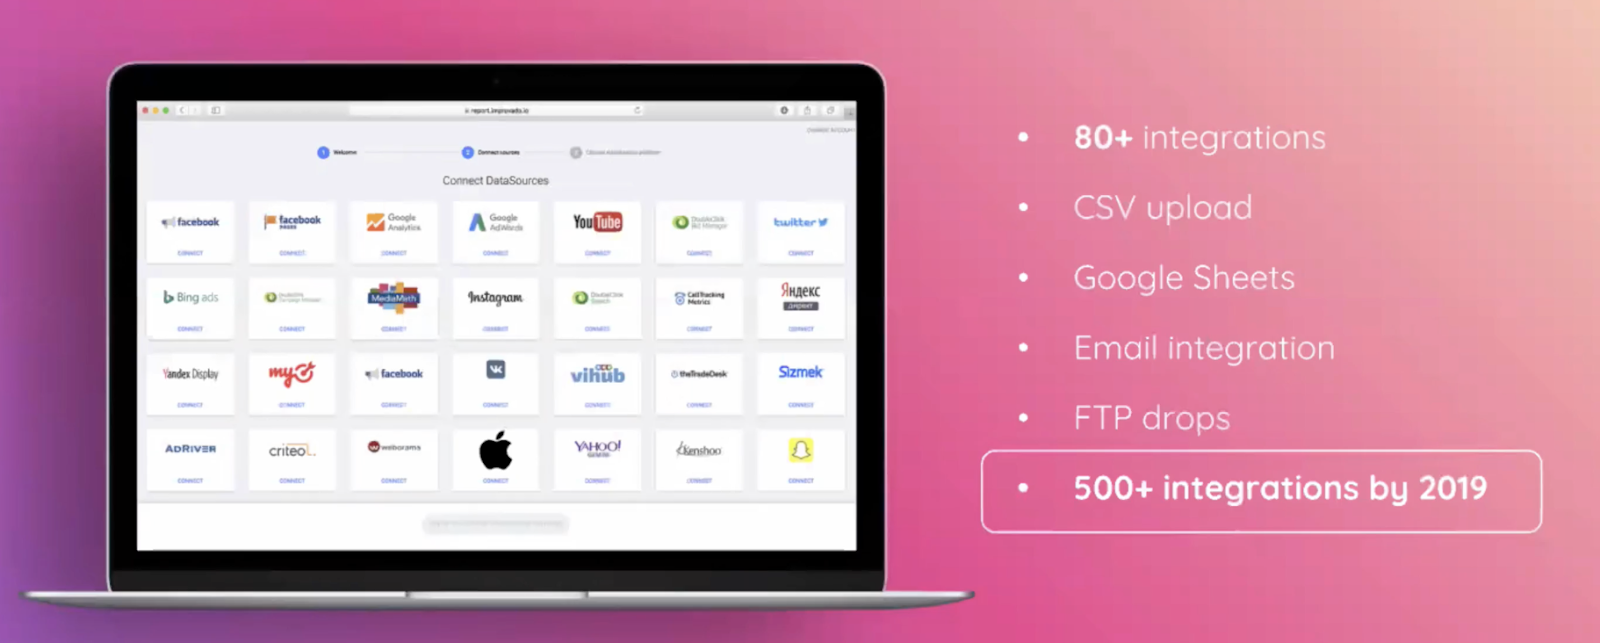
The image above gives you a little preview as to how Improvado works.
With Improvado, you can sync with all the different marketing platforms that you’re using, like Facebook, Adwords, Google Analytics, Linkedin, Pinterest, Twitter etc.– you name it. We have about 80 different marketing platform integrations, and we can build out any custom integration you need.
And then you can map that data together and send it to any business intelligence (BI) tool like Tableau, Looker, Google Data Studio or PowerBI.
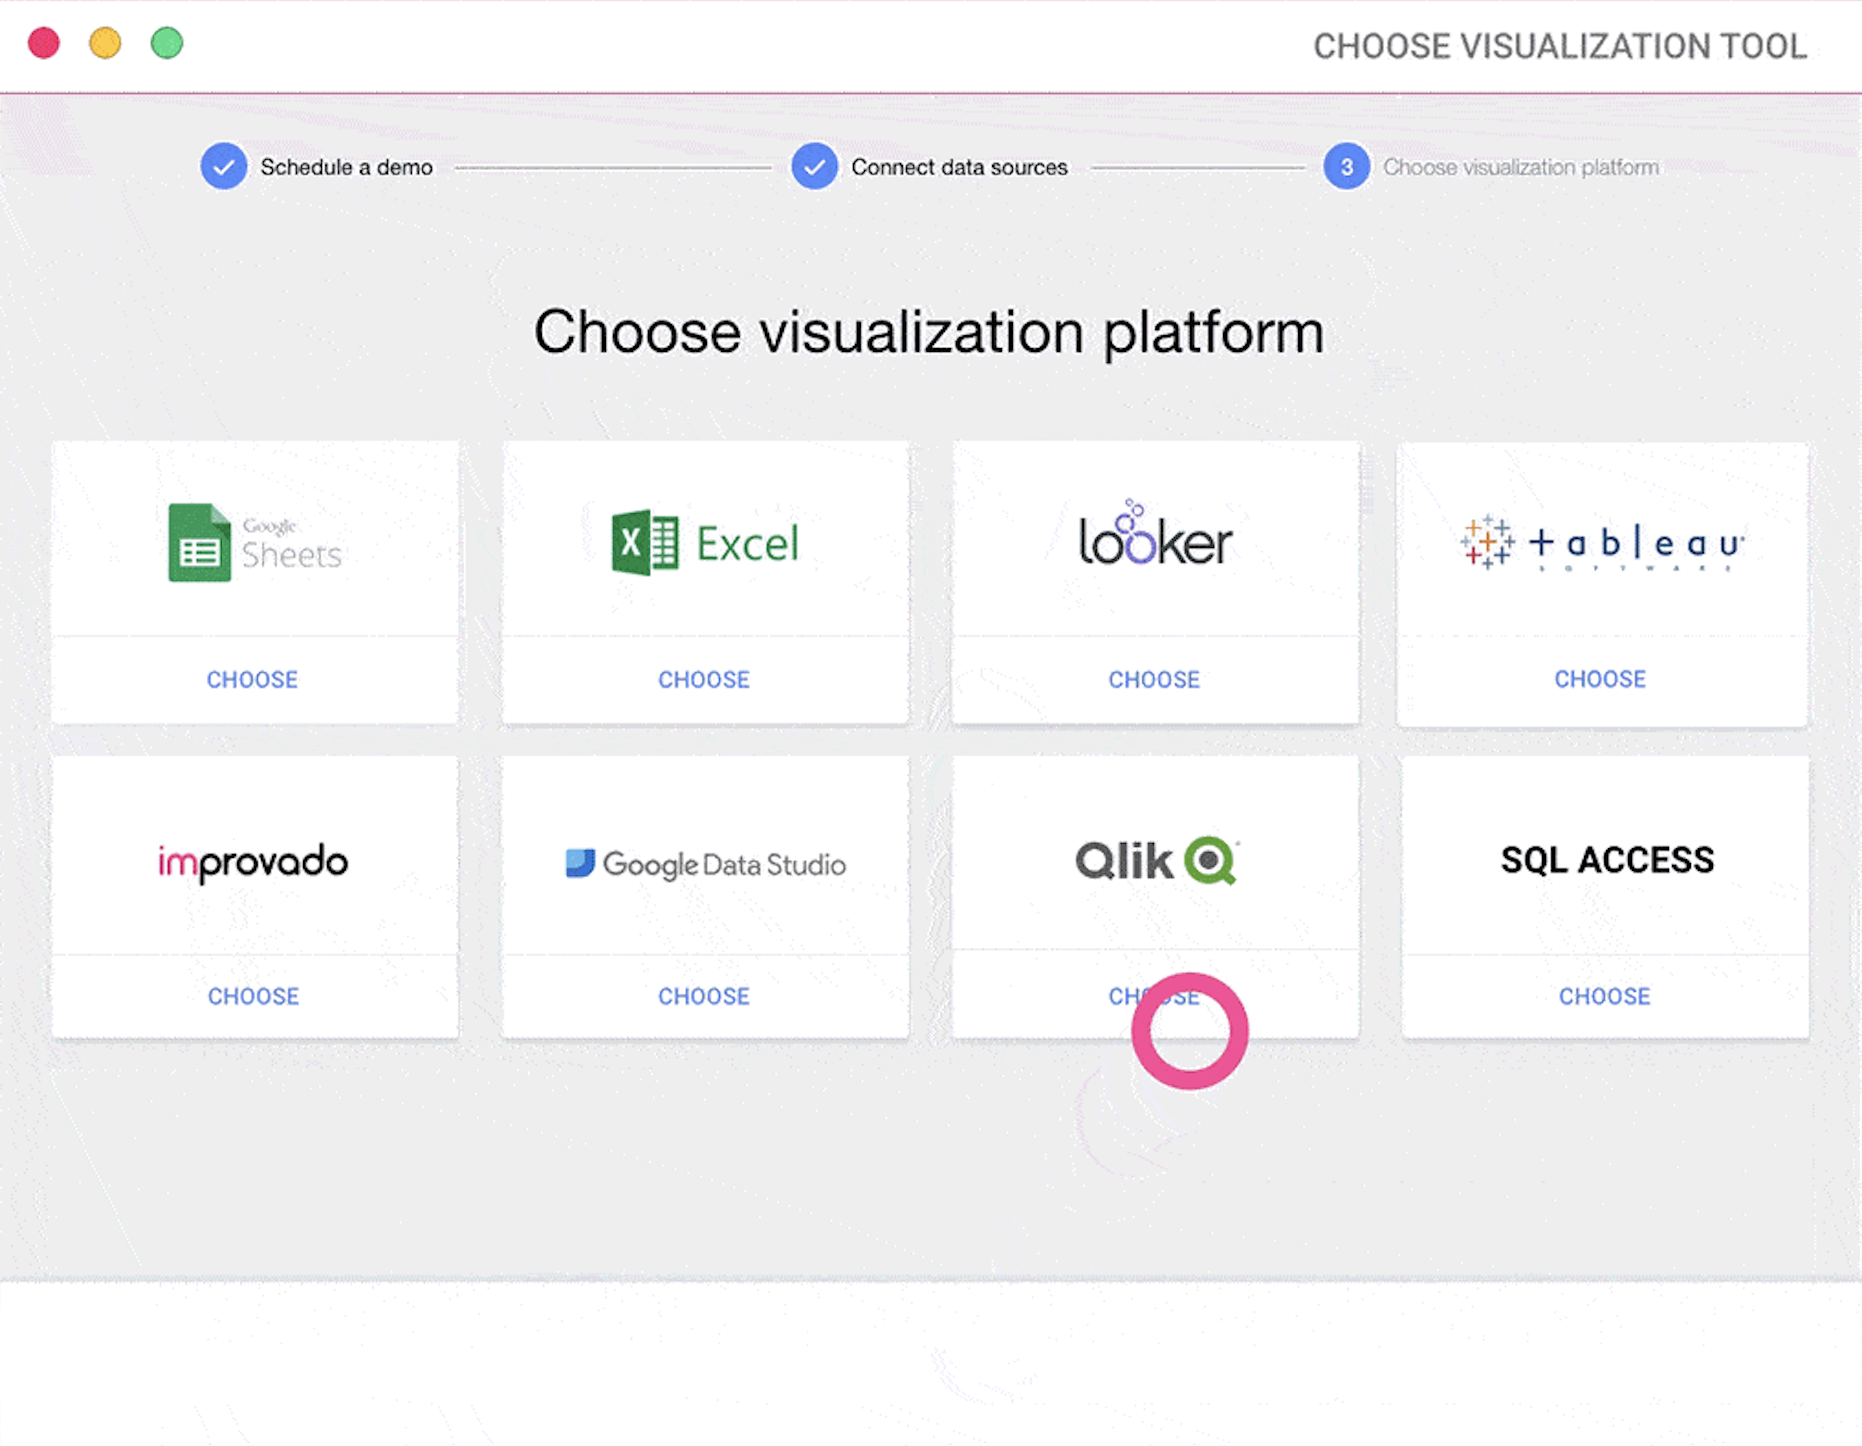
OR you can just visualize all your data right from within the Improvado platform.
The cool thing about Improvado is that it was built by marketers.
Improvado was actually first a marketing agency. And after talking to hundreds of their clients, they realized that aggregating marketing data was a huge pain point for so many people.
As part of their marketing agency, they had a tool, that they were letting clients use for free, that was automating the collection of all their marketing data into automated dashboards.
And eventually, all the clients said “Hey, you know we would pay just for access to this tool. It’s amazing.”
And so Improvado pivoted from an agency, into a Saas tool. So that they could help more marketers with data aggregation and reporting.
All the integrations are built specifically for marketers, based on the channels that marketers use.
So once you connect all your channels to Improvado, it automatically slurps up all your data, and you can view it wherever you’d like. In spreadsheets, in Improvado or any BI tool to visualize the data.
So Improvado pulls your data from all these places and brings it into one place.
How to View Every Digital Marketing Channel in One Dashboard
Before I used Improvado, If I wanted to know how much money I had spent on a specific channel, or how an individual ad was performing, I had to log into each marketing platform individually and click around until I found the data I needed.
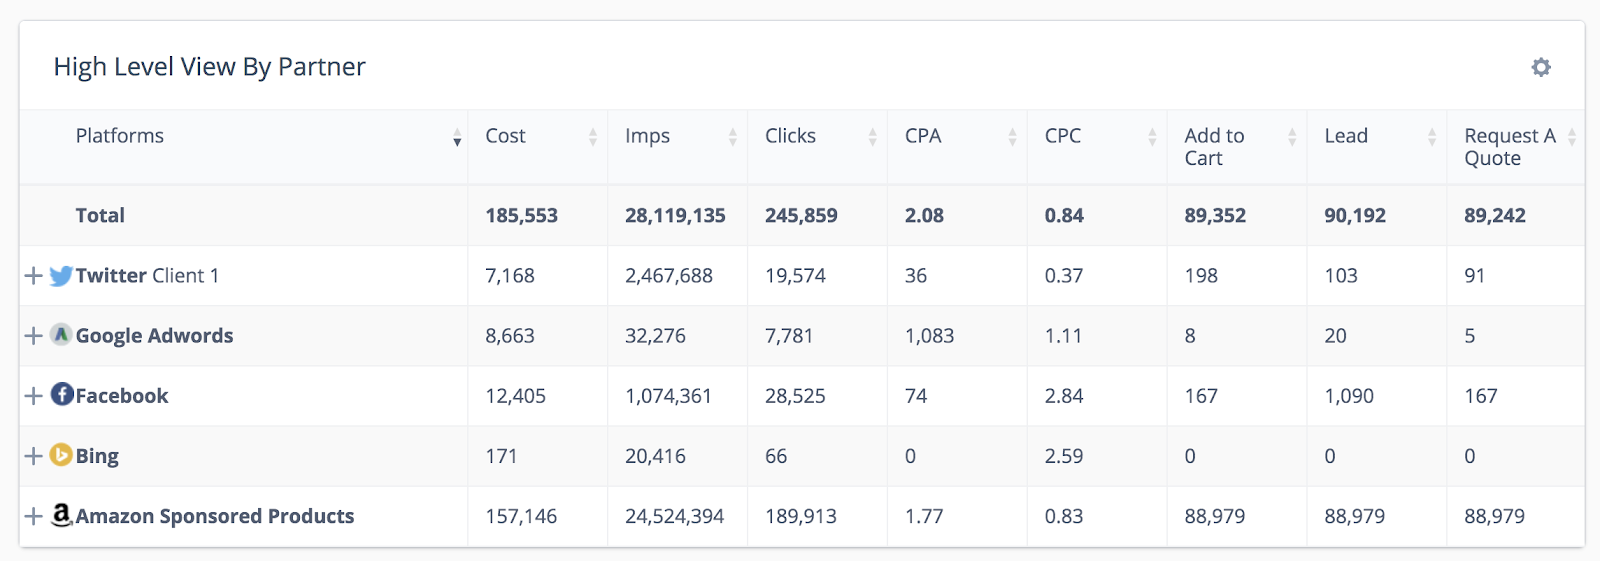
Now, I can see all that data from every platform whenever I want, just by logging into my Improvado marketing dashboard.
You can instantly always see real-time cost data across all the platforms you’re running digital marketing ads on.
This includes things like:
- Impressions
- Cost
- Clicks
- CPA
- Leads
- Revenue
- CTR
Any data that you can see within an individual marketing platform, you can now see from within one dashboard using Improvado.
How to get Granular Digital Marketing Data
Since Improvado was built by marketers– they make sure that you can see everything about your marketing campaigns even at the most granular level.
For example, if you’re running an Adwords campaign, and you are trying to optimize your campaigns from within the Adwords dashboard, you’d have to do a lot of clicking as you look for patterns and trends in performance.
However, from the Improvado dashboard, it’s easy to see everything displayed for you clearly all in one place. You will be able to see performance right down to the keyword level or ad copy level.
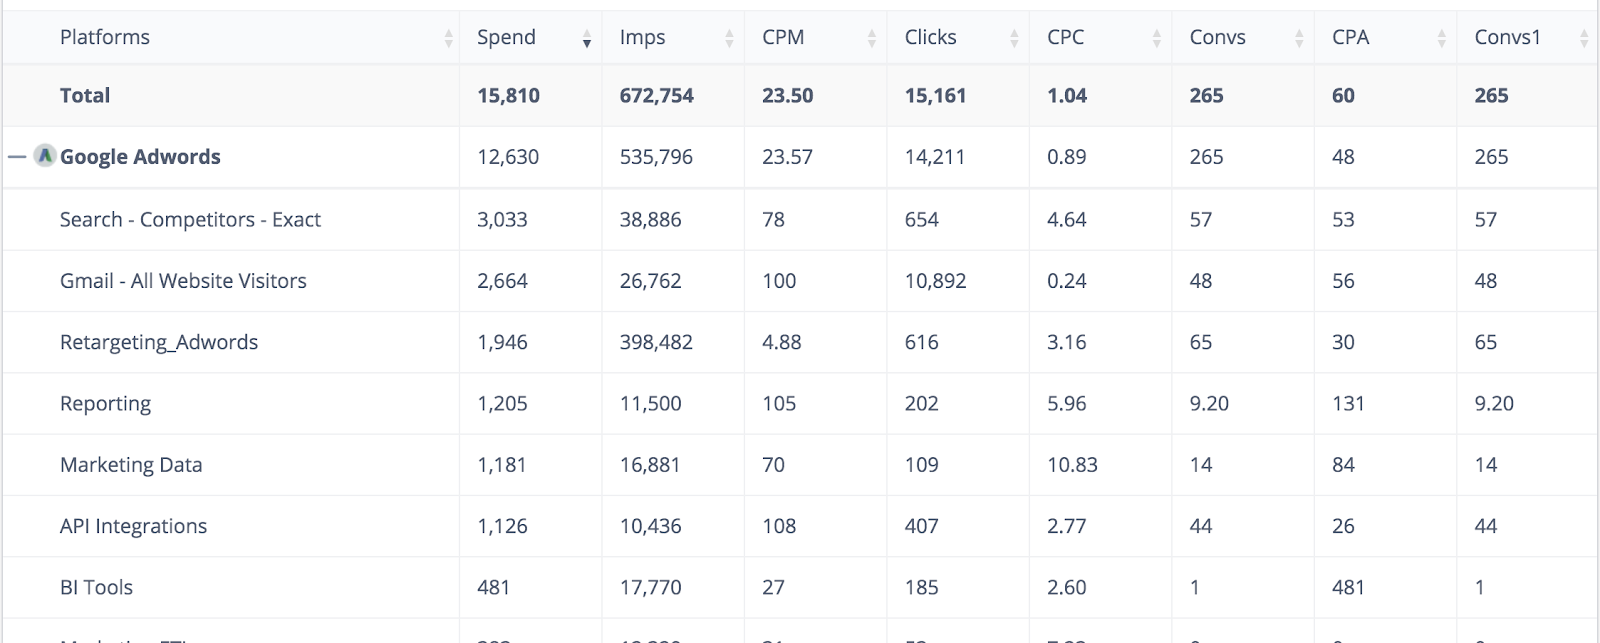
Right from your Improvado dashboard.
See the spend in different campaigns, the impressions the clicks, everything.
Sync Data from Every Marketing Channel in Minutes
You can sync data from any marketing channel in minutes, and even if you have offline data in a CSV, Google Sheet or send to you in an email, you can upload that data to Improvado and visualize it alongside the rest of your data.
Send Your Marketing Data to Any BI Tool
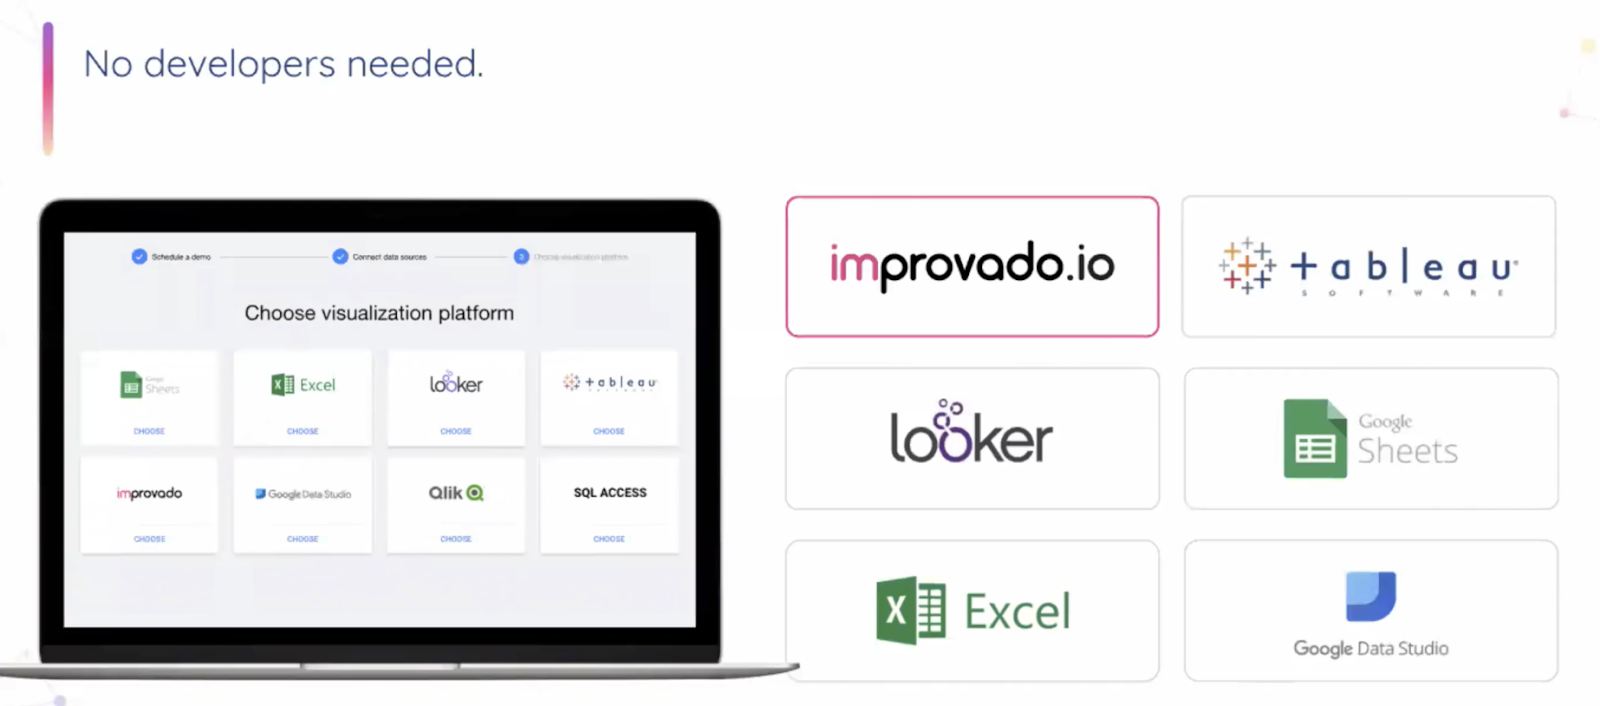
This is a key selling point for many marketers. You don’t need any developers in order to automate your marketing data.
Marketers often struggle to get attention from the software engineers on their team. Those guys are busy doing important work, like building the product. They have all the other company stakeholders asking them for things like product updates.
The last thing they want to get stuck doing is building out API integrations for the marketing team so that they can automate their data. It’s just not high on their list of priorities– nor should it be because there are better plug and play solutions to solve this.
There’s Improvado 🙂
Which is way cheaper than having an engineer spending months or even years building out and maintaining these integrations for a marketing team.
Visualize Your Marketing Data- Showcase Performance
Like I mentioned earlier, you want to create visual, real-time marketing reports for your leadership team so that they can quickly and easily understand marketing performance.
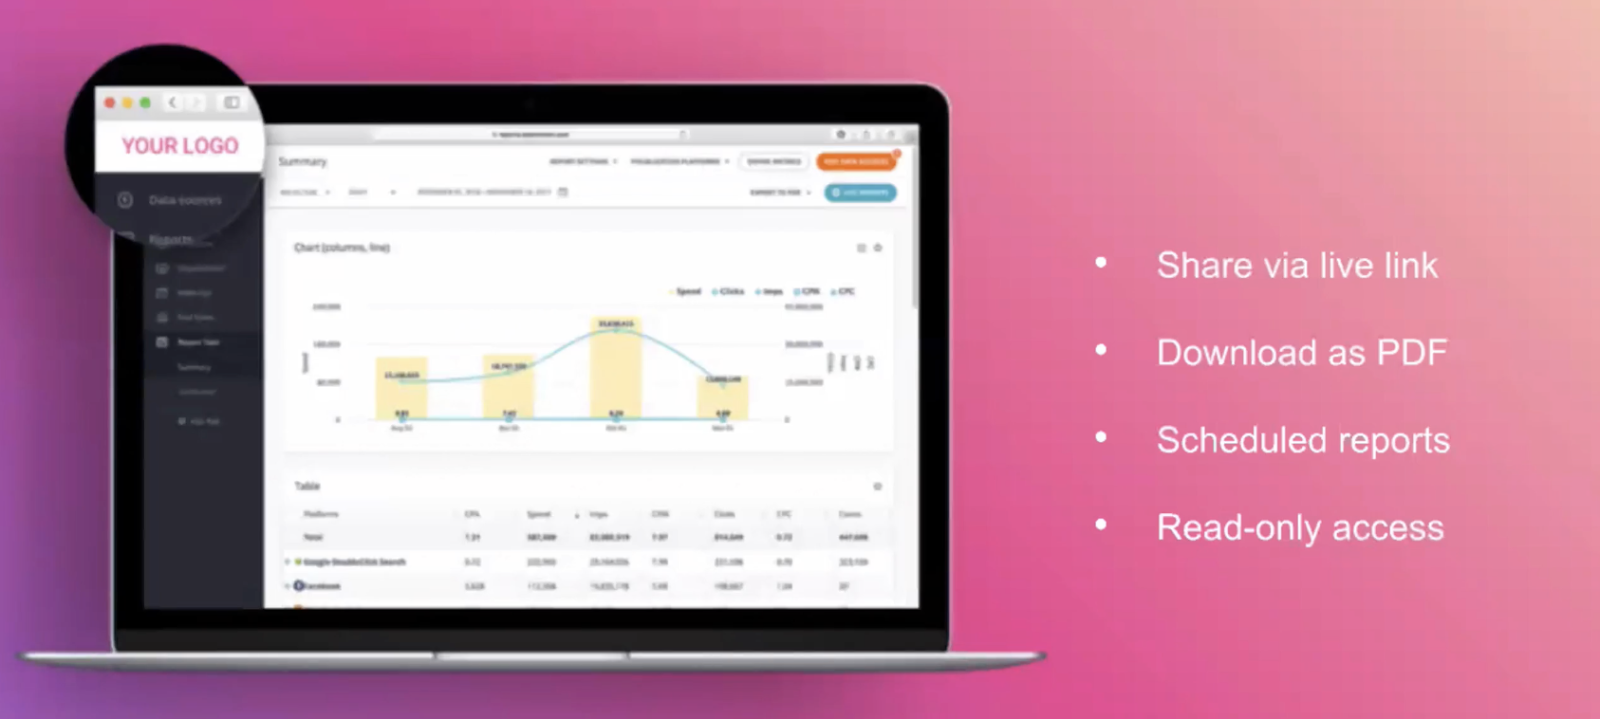
Improvado allows your to share your real-time marketing dashboard and reports via live link, PDF, sending scheduled reports or providing read-only access for internal stakeholders or external clients in the case of marketing agencies.
If you’re a marketing agency, your clients don’t want to wait every week or every month for you to send them a report that took you 20 hours to make. They should be able to login in real time and get a view of the status of their marketing campaigns- without having to bug you and ask you questions.
In Conclusion
This tool is kind of a big deal. I’m super excited about it. It’s an amazing tool and I would not have joined the team at Improvado, I actually had a lot of other options when I was trying to decide on my next role, but I was passionate about helping marketers and spreading the word about what this tool can do to save them time and help them become more efficient.
I hope you found this article helpful.
There are a few takeaways I want to leave you with:
- If you’re not ready to automate your data and you first need to pull it all together manually, I have this downloadable marketing dashboard that I made just for you.
And don’t worry– you are not alone. I was there with you just a few months ago, pulling all my data together manually. So if I could do it, that means you can do it too 🙂
OR
- If you want to learn more about Improvado, you can visit the site here or you can just schedule a demo right here.
Do it TODAY and if you tell them that Hailey sent you, you’ll get one month free ?


Hi Hailey, I have a question. When you track an opportunity, are you tracking it against the month in which it converted from lead to opportunity? Or are you going back and counting it against the month in which that lead was created… saying “as of this latest report, x of our July leads have become opportunities?” So say you had a lead created in July and it it converts to an opportunity in September. Do you count that opportunity against July or September?